

Graphify reaches 150K GitHub stars in under eight months
· 7 minute read


Graphify passed 150,000 GitHub stars on Graphify-Labs/graphify on the evening of 18 November 2026, under eight months after the repository was created on 3 April 2026. It has now been forked more than 14,000 times.
Thank you to everyone who has tried Graphify, contributed to it, shared it, or helped someone else get started. Seeing this much interest in something we started building in April is a moment worth stopping to appreciate.
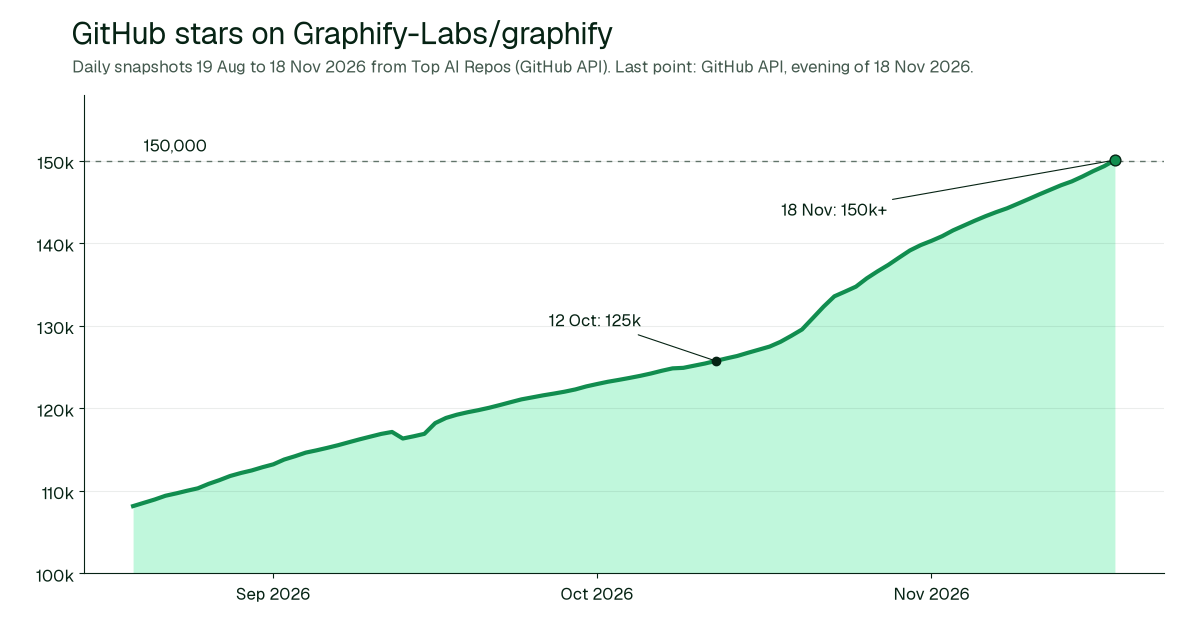
Daily star counts for Graphify-Labs/graphify from 19 August to 18 November 2026, recorded by Top AI Repos from the GitHub API. The last point is our own GitHub API reading from the evening of 18 November 2026, after the count passed 150k.
Why we built Graphify: a map of the code for engineers and agentsLink to Why we built Graphify: a map of the code for engineers and agents
When we published Graphify, the idea was straightforward: give engineers and their AI agents a useful map of the code they work on. That idea still drives the product.
An agent working on a function needs to understand the code around it. Who calls it? Which services depend on its behavior? Which tests cover the paths it touches? What might break somewhere else if its return value changes?
Engineers ask these questions every day. The answers are spread across files, repositories, languages and the people who remember why a system works the way it does. As agents take on more engineering work, those connections matter more.
Graphify is shared codebase context for coding agents and the people who work with them. Underneath is a code graph of the functions, classes, files and calls in your repositories, and every relationship records where it came from, tagged EXTRACTED, INFERRED or AMBIGUOUS. Built on top of it are a Wiki for each repository, Memory that agents and teammates share, and pull request reviews. Engineers and agents can trace calls, inspect dependencies and go back to the source lines behind an answer. See how Graphify works.
Take a change to a shared billing function. The diff might be a few lines. A useful review also asks which callers expect the old behavior, whether another service relies on the same types, and where the relevant tests live. That is the context we want in front of you before a change ships.
What shipped since 100,000 GitHub starsLink to What shipped since 100,000 GitHub stars
Since our 100,000 stars post in August, the ways to use that context have grown.
- Graphify CLI. Open-source Graphify builds the graph on your own machine and writes it to
graphify-out/. - Hosted Graphify. app.graphify.com gives a team one shared place to index GitHub or GitLab repositories and explore the graph, rebuilt on every push to the default branch. Claude Code, Cursor, Codex and other MCP clients query the same indexed context through one server. Connect an agent.
- Pull request reviews. Reviews use the graph to see what a change touches. When repositories are combined into a cross-repository graph, a review also lists affected callers and dependents in the other indexed repositories. Read about Graphify reviews.
- Claude connector. On 11 November Graphify became an official Claude connector, so going from discovering Graphify to asking Claude about your own repository is a much shorter path. Graphify ranks in the top 200 of the entire Claude connector directory.
There were a few other moments worth celebrating along the way:
- 12 October. 125,000 GitHub stars.
- Octoverse 2026. GitHub's Octoverse report placed Graphify-Labs/graphify seventh among the most-engaged open source repositories in its single vendor and product-led group. We wrote about it here.
- 6 November. Open-source Graphify passed 10 million downloads on PyPI.
- 18 November. 150,000 GitHub stars, 37 days after 125,000. The chart shows the climb got steeper in late October and stayed that way into November.
How fast is 150,000 GitHub stars for a YC company?Link to How fast is 150,000 GitHub stars for a YC company?
Graphify Labs is in Y Combinator's Summer 2026 batch. The repository was created on 3 April 2026, so 150,000 stars took 229 days. As far as we can tell, that makes Graphify the fastest YC company to take an open-source project to 150,000 GitHub stars.
Here is what we checked. Two other YC companies have repositories above 150,000 stars today: Ollama (Winter 2021) and Firecrawl (Summer 2022), both strong open-source projects we admire. Archived copies of their GitHub pages on the Internet Archive show Ollama at 142,322 stars on 31 May 2025, 23 months after its repository was created, and Firecrawl at 48,956 on 18 August 2025, 16 months after its repository was created. Other YC projects we looked at, Supabase and Browser Use, are not at 150,000 yet. We have not checked every YC company's GitHub, so if we missed one, tell us and we will correct this post.
When Graphify passed 100,000 stars in the summer, Jared Friedman, a partner at Y Combinator, posted this:
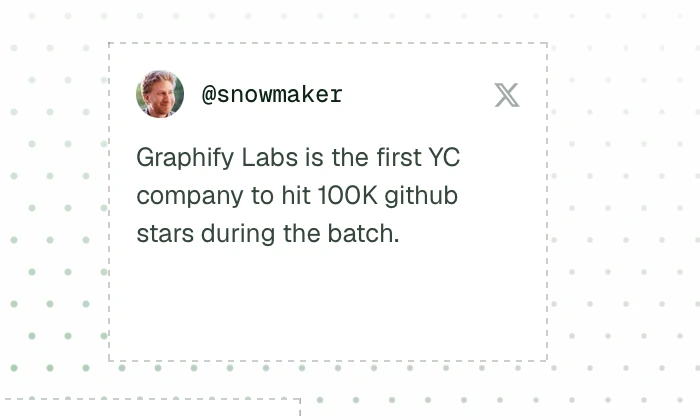
Jared Friedman on X, 2 August 2026
Thank you to the Graphify open source communityLink to Thank you to the Graphify open source community
GitHub counts 400 contributors with commits in the repository. Since 12 October, people have opened 346 issues and 617 pull requests, and 840 commits have landed on the default branch. We shipped 26 releases in that time. On PyPI, pepy.tech counts more than 11 million downloads of the graphifyy package.
The best feedback is still a concrete engineering question: a dependency someone could not follow, a connection the graph missed, or a review that needed better context. Those examples tell us where the product needs to improve. A reproducible issue helps us understand a failure. A pull request improves what everyone can use. A tutorial helps another developer get started. Honest feedback helps us decide what deserves attention next.
So thank you to everyone who opened an issue, sent a pull request, answered a question in Discord, or wrote about Graphify. And thank you to everyone who starred the repo.
We also owe a great deal to the open source projects Graphify builds on, and to the people who maintain them:
- tree-sitter turns source files into the syntax trees every code edge starts from.
- Leiden community detection is how a repository splits into the subsystems you see on the graph.
- Model Context Protocol is how coding agents call Graphify.
- uv is why installing Graphify CLI takes one short command.
Open-source Graphify is Apache 2.0, and it stays that way. You can inspect the implementation, run it locally and contribute to it. That openness is part of how we want to earn developers' trust as Graphify becomes a larger part of their workflow. Explore the repository on GitHub.
What comes next for GraphifyLink to What comes next for Graphify
Our focus from here is making the graph more useful in everyday engineering: clearer relationships across repositories, context that stays current as code changes, and answers that engineers can check against the source. The same understanding should help a developer investigating a system and an agent preparing its next change.
How to try GraphifyLink to How to try Graphify
Start with one repository and one question you already care about. Trace a function's callers. Follow a dependency. Ask what a proposed change could affect. That is the best way to see where Graphify helps and where we still have work to do.
The quickest way in is hosted Graphify. Open app.graphify.com, connect a repository, and connect your coding agent to the hosted MCP server at https://api.graphify.com/mcp. It signs in with OAuth in the browser, so there is no API key to paste, and the Free plan covers up to 3 repositories with no card. Graphify in 5 minutes walks through it.
Install Graphify CLILink to Install Graphify CLI
To run open-source Graphify on your own machine:
uv tool install graphifyy
graphify install
Then type /graphify . in Claude Code to build the graph of the current folder. The Graphify CLI quickstart covers other agents and the git hooks that keep the graph current.
If Graphify has been useful to you, a star on GitHub still helps other developers find it. Thank you for helping Graphify get this far.
Thanks,
Syed Fahad, Safi Shamsi & Team Graphify
